АвтоАвтоматизацияАрхитектураАстрономияАудитБиологияБухгалтерияВоенное делоГенетикаГеографияГеологияГосударствоДомДругоеЖурналистика и СМИИзобретательствоИностранные языкиИнформатикаИскусствоИсторияКомпьютерыКулинарияКультураЛексикологияЛитератураЛогикаМаркетингМатематикаМашиностроениеМедицинаМенеджментМеталлы и СваркаМеханикаМузыкаНаселениеОбразованиеОхрана безопасности жизниОхрана ТрудаПедагогикаПолитикаПравоПриборостроениеПрограммированиеПроизводствоПромышленностьПсихологияРадиоРегилияСвязьСоциологияСпортСтандартизацияСтроительствоТехнологииТорговляТуризмФизикаФизиологияФилософияФинансыХимияХозяйствоЦеннообразованиеЧерчениеЭкологияЭконометрикаЭкономикаЭлектроникаЮриспунденкция
Standard Deviation
|
Читайте также: |
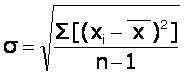
Now, for those who would like to go a little further in error theory, we can turn our attention to the third column of figures in the Table above. These figures are the squares of the deviations from the mean. Without going into any theoretical explanation, it is common practice for scientists to use a quantity called the sample standard deviation of a set of readings as an estimate of the error in a measured quantity. The standard deviation, s (lower case sigma), is calculated from the squares of the deviations from the mean using the following formula:
From the 3rd column above we have
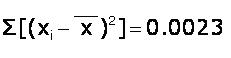
And n (the number of readings) = 10. Therefore, s = 0.0160
We could therefore report the diameter of the copper wire as 0.72 ± 0.016 mm (a 2% error). This means that the diameter lies between 0.704 mm and 0.736 mm. Note that we still only quote a maximum of two significant figures in reporting the diameter.
Why do scientists use standard deviation as an estimate of the error in a measured quantity? Well, the standard deviation of a set of experimental data is a reliable statistical measure of the variability or spread of the data from the mean. A high standard deviation indicates that the data is spread out over a large range of values, whereas a low standard deviation indicates that the data values tend to be very close to the mean.
Also, standard deviation gives us a measure of the percentage of data values that lie within set distances from the mean. If a data distribution is approximately normal then about 68% of the data values are within 1 standard deviation of the mean (mathematically, μ ± σ, where μ is the arithmetic mean), about 95% are within two standard deviations (μ ± 2σ), and about 99.7% lie within 3 standard deviations (μ ± 3σ). So, when we quote the standard deviation as an estimate of the error in a measured quantity, we know that our error range around our mean (“true”) value covers the majority of our data values. In other words, it can give us a level of confidence in our error estimate. If you wish, you could quote the error estimate as two standard deviations.
Поиск по сайту: